

Brief description of the method
EPR phenomenon is observed for materials placed in an external magnetic field and it consists of absorption of electromagnetic radiation in the radio-frequency range due to the quantum transitions between electron magnetic dipole moment energy levels. EPR is sometimes called ESR (electron spin resonance) or FMR (ferromagnetic resonance; this term is mostly used by people working with magnetically ordered materials).
EPR can be observed for
- atoms and molecules having odd number of electrons – H, N, NO2;
- chemical elements in various oxidation states, having not all outer-shell electrons participating in bond formation – primarily, d- and f-elements;
- free radicals – CH3-radical, NO-radical etc.;
- electron and hole defects stabilized in crystal lattice – Oˉ, O2ˉ, CO2¯, CO23ˉ, CO3ˉ, CO33ˉ etc.;
- molecules with even number of electrons, which are paramagnetic nevertheless due to the peculiarities of the electron shell structure, such as O2;
- superparamegnetic nanoparticles having overall magnetic moment (“collective spin”) and behaving like an electron gas.
Behavior of electron magnetic dipole moments in magnetic field depends on their interactions with each other and with surroundings. The most important ones are usually electron spin-spin and spin-orbital interactions, electron-nuclear spin interactions, as well as interactions with electrostatic potential created by the surrounding charges at the place there the electron spin is localized. The majority of these interactions manifest themselves in various splittings of the EPR signals. In the scheme 1 we show the hierarchy of these splittings.
Scheme 1. Splittings of the EPR signals.

Main characteristics of EPR spectrum of a paramagnetic center (PC) are as follows.
- Number of lines and their relative intensities.
Fine structure (FS). Number of FS lines is given by the electron spin quantum number S and by the local symmetry. The relative intensities of the lines are given by the quantum number mS (spin projection in the magnetic field direction). In crystals the distance between the lines is determined by the strength of the crystal field and its symmetry.
Hyperfine structure (HFS). The number of HFS lines is determined by the spin quantum number I of the nucleus on which the PC is localized. HFS lines of a particular isotope are equidistant and have almost identical intensity. The distance between lines depends on the nuclear gyromagnetic ratio, hyperfine splitting constant and the degree of electron spin delocalization. If the nucleus of a given PC has several isotopes, each one of them is giving its own splitting pattern with relative intensity proportional to the natural abundance of this isotope.
Superhyperfine structure (SHFS). The number of SHFS lines depends on the number nlig of equivalent nuclei (sometimes called ligands) with which electron spin is interacting and on the spin quantum number Ilig of these nuclei. Characteristic for SHFS lines is the distribution of integral intensities, which in case of Ilig = ½ is binomial (similar to spin multiplets in NMR spectra). As for HFS, the distance between SHFS lines is determined by the ligand’s nuclear gyromagnetic ratios, hyperfine splitting constants and the degree of electron spin delocalization on ligands.
- Spectral parameters of a given line. For several reasons EPR spectrum is recorded not as an absorption line (see figure 1a), but as its derivative (dispersion line; see figure 1b). Because of that in EPR spectroscopy the nomenclature is slightly different from conventional one for other types of spectroscopy.

Fig. 1. a - absorption line; b - dispersion line.
Line shape –Lorenzian, Gaussian or a mixed one;
Line width – ΔВmax –the distance between extrema of the dispersion curve along the B axis;
Line amplitude – Imax –the distance between extrema of the dispersion curve along the I axis;
Line intensity – I0 – peak amplitude of the absorption curve;
Line integral intensity – area under the absorption curve;
Line position – В0 – corresponds to the intersection of the dispersion curve with the baseline;
- Signal position in EPR spectrum. According to the equation ħν = gβB, which determines the resonance conditions for a PC with S = ½, the position of the signal can be describes by g-factor. The latter is defined as the ratio of the frequency ν, on which the spectrum was recorded, to the value of the field strength В0, at which the absorption was maximal. Note, that g-factor characterizes PC as a whole and not individual lines in EPR spectrum.
In EPR spectroscopy the frequency ν is usually fixed, while the magnetic field B is swept. Traditionally, the frequency bands have their own names as given in the table 1.
Table 1. EPR frequency bands.
| BAND | Frequency ν, MHz (GHz) | Wavelength λ, mm | Field strength В0, at which a free electron with g = 2.0023 would resonate, Gauss (Tesla) |
|---|---|---|---|
|
L |
1000 (1) |
300 |
300 (0.03) |
|
S |
3000 (3) |
100 |
1100 (0.11) |
|
X |
9500 (9.5) |
32 |
3300 (0.33) |
|
K |
24000 (24) |
12.5 |
8600 (0.86) |
|
Q |
35000 (35) |
8.5 |
12500 (1.25) |
|
W |
95000 (95) |
3.2 |
34000 (3.40) |
|
- |
190000 (190) |
1.6 |
68000 (6.80) |
X-band and Q-band EPR spectrometers are probably the most widely used nowadays. They usually are equipped with an electromagnet. Higher frequency spectrometers usually employ superconducting magnets.
Examples of EPR applications
The applications of EPR are numerous and widely spread over the fields of interest, so that it is hard to give a comprehensive overview. For some more specialized reviews see [36-38]. Below we give three examples of EPR applications, carried out recently with the participation of some of us.
EPR dating
Tooth enamel consists of almost exclusively hydroxyapatite Ca(1)4Ca(2)6(PO4)6(OH)2 with 3-4% of carbonates. Irradiation of tooth enamel with gamma-radiation leads to the formation of carbonate anions CO2-, CO3-, CO- и CO33-. The EPR signal of these defects can be used in dosimetry, dating and medical applications. In Fig. 15 we show a photograph of a tooth of extinct species Bison antiquus. The samples were collected in 2005 by archeological expedition organized by Russian Academy of Sciences at Berezovskij coal mining facility (see the red dot on the map). The EPR spectrum of the tooth enamel (Fig. 2, left) shows signals from CO2- radicals created by the radiation coming from the soil surrounding the buried tooth. The intensity of the signal can be calibrated (Fig. 2, right) allowing one to estimate the amount of accumulated radiation, which then can be converted into the tooth age. In the particular case shown in the figure the age was estimated to be 18000 ± 3000 years (Artem Antipov, “EPR-dating of tooth enamel”, 2012, Master thesis, supervised by S.M. Sukharzhevskii).

Fig. 2. EPR dating of tooth enamel. (Top left) the archeological excavation site location; (top center) photograph of one of the excavated teeth; (top right) part of the tooth from which the enamel samples were collected; (bottom left) EPR spectrum of the tooth enamel; (bottom right) calibration curve for the age estimation.
Wood damage by microorganisms
Wooden parts of museum exhibits are often subject to degradation due to microorganisms which extract nutrients from wood. From EPR point of view, degradation manifests itself as wood depletion of microelements (such as Fe3+ and Mn2+) and increase of the bioradicals concentration. This process can be illustrated by EPR spectra of fresh wood samples (pine and alder) and wood samples from XVIII century gun carriages, shown in Fig. 3.

Fig. 3. EPR spectra of fresh wood samples (pine and alder) and wood samples from XVIII century gun carriages (museum exhibits). Spectra show depletion of microelements and increase of bioradical concentration, indicating degradation of wood by microorganisms.
Marble contamination with fungi
Marble is essentially a mineral consisting of calcite CaCO3 and dolomite CaMgCO3. The existing databases of EPR spectra allow one to pinpoint the origin of the marble sample, sometimes with the precision of a particular mine (see Fig. 4, left). Fungi contamination can damage the historical and cultural monuments name of marble. EPR spectroscopy can also be used to determine the particular strain of fungi (Fig. 4, center). Isolating fungi from the marble surface one can identify the contaminating fungi and study the process of marble degradation (Fig. 4, right). The average sample weight for EPR analysis is ca. 1-3 mg.
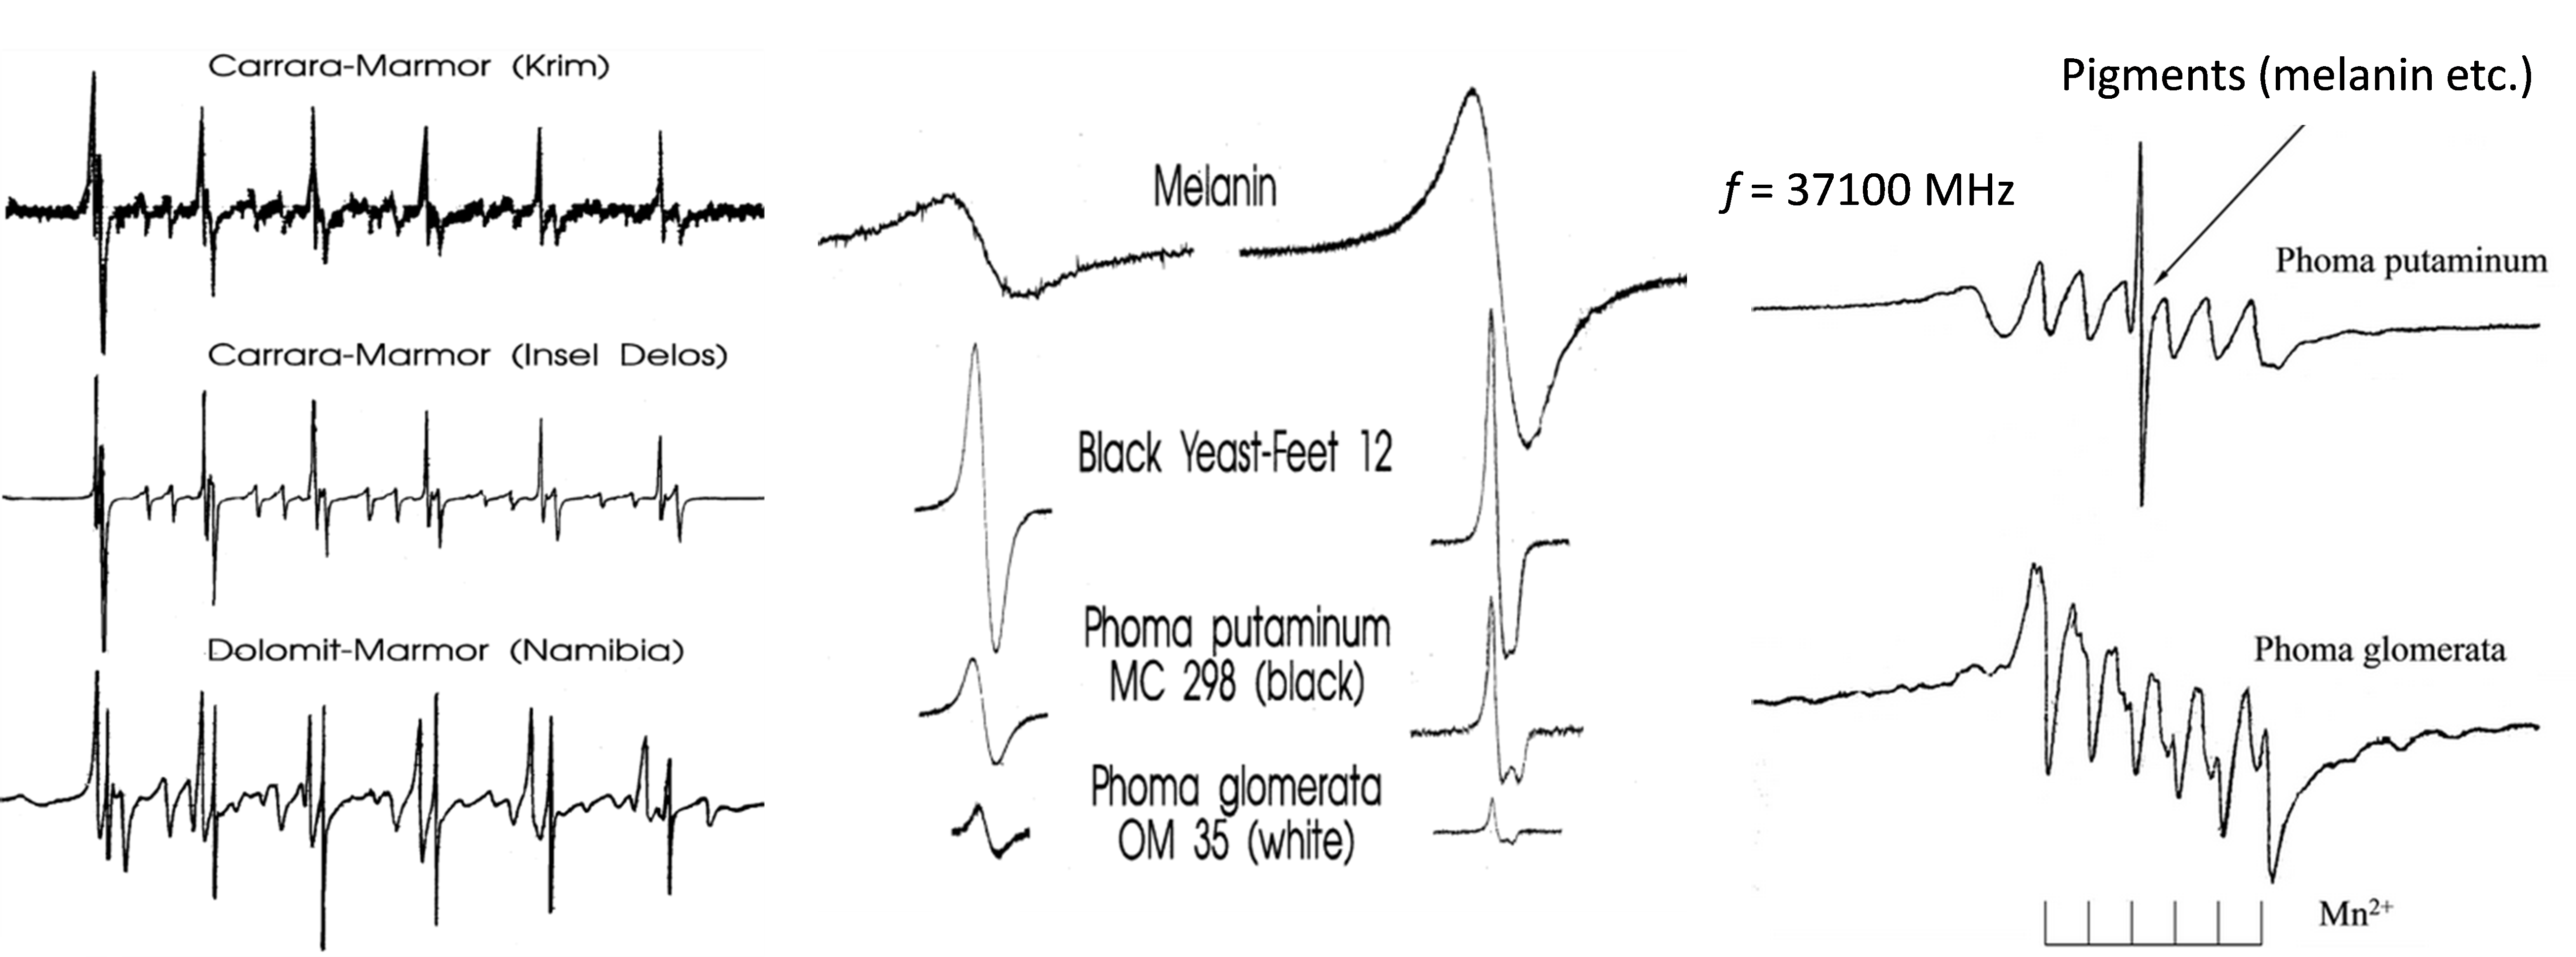
Fig. 4. EPR spectra of various marbles (Mn2+ centers) (left), melanin and fungi strains (grown on nutrients) (center) and fungi isolated from marble surface (right).
Currently available at CMR
In Center for Magnetic Resonance an X-band Bruker Elexsys E580 spectrometer is installed with an electromagnet sweeping field from -11000 Gauss to +11000 Gauss. Spectrometer is capable of working in both CW- and FT-regimes. Such techniques as ESE or ENDOR are available.
1. CW
The default method for measurement of EPR spectra at CMR is CW-regime or slow passing through the resonance conditions. In this regime all classical methods are being realized. The CW-regime is used to obtain information about the physical nature of the paramagnetic center, its localization in the matrix of the sample or about its local environment. First and foremost, the investigation of paramagnetic centers in CW-regime allows one to collect information about the possible energy states of the studied object. Information about the dynamic characteristics of the spin systems could be obtained by changing the temperature or by optical irradiation of the sample. For paramagnetic center in triplet state the optical irradiation of the sample is mandatory.
2. FT
To study the dynamic characteristics of paramagnetic centers is it possible to use pulsed EPR methods (FT-regime). In such experiments the sample in a certain energy state is subjected to a strong pulsed radiation. As a result, the spin system leaves the equilibrium state and the response of the system is being detected. By choosing various pulse sequences and other parameters (pulse durations, delays, aplitudes etc.) one can significantly broaden the available data about the paramagnetic center, including its T1 and T2 relaxation times, diffusion rates etc.

")