

Further reading:
1. T.D.W. Claridge, "High-resolution NMR techniques in Organic Chemistry", 2nd ed., Elsevier, 2009.
2. H. Friebolin, "Basic One- and Two-Dimensional NMR Spectroscopy", 3rd ed. , Wiley-VCH, 1998.
3. J. K. M. Sanders, B. K. Hunter, "Modern NMR Spectroscopy, A Guide for Chemists", 2nd ed., Oxford University Press, 1993.
2. 1D selective NOESY
This technique allows one to obtain information about nearest neighbors in space of a given proton.

Further reading:
1. C.J. Bauer, R. Freeman, T. Frenkiel, J. Keeler & A.J. Shaka, J. Magn. Reson., 1984, 58, 442.
2. H. Kessler, H. Oschkinat, C. Griesinger & W. Bermel, J. Magn. Reson., 1986, 70, 106.
3. J. Stonehouse, P. Adell, J. Keeler & A.J. Shaka, J. Am. Chem. Soc., 1994, 116, 6037.
4. K. Stott, J. Stonehouse, J. Keeler, T.L. Hwang & A.J. Shaka, J. Am. Chem. Soc., 1995, 117, 4199-4200.
3. 1H with signal presaturation, 1H WATERGATE, WEFT
This methods allow one to suppress intensive signals form the solvent (e.g. H2O), which leads to the increased sensitivity for weak signals.
1Н with signal presaturation – method of signal suppression, in which the resonance transitions of the solvent nuclei are saturated prior to the acquisition by using weak selective pulses (duration of the irradiation is comparable to the relaxation time T1 of the solvent). In this method several solvent signals could be suppressed. The disadvantage is that not only solvent signals could be influenced, but also the neighboring ones.
1Н WATERGATE (GrAdient Tailored Excitation) — method of signal suppression using special gradient excitation. This approach allows one to suppress, for example, water signal in aqueous solutions. In contrast to the presaturation method, in WATERGATE gradient spin echo is being used.
The pulse sequence is shown in the Figure:

[Garry S.H. Lee, Michael A. Wilson, Brent R. Young, Organic Geochemistry, V. 28 (9–10), 1998, 549.]
In its core this is a Hahn echo PGSE pulse sequence with short delay t, in which regular 180° pulse is changed for a selective 180° pulse inverting all resonance signals except for those of the solvent. This 180° pulse does not affect nuclear spin coherence of the solvent created by the 90° pulse and thus the coherence is destroyed by dephasing induced by the pair of gradient pulses. For the other signals the dephasing of two gradient pulses is compensated.
The selective 180° pulse could induce significant phase distortions in the spectrum. This could be remedied by using the pulse sequence
g1 – S – g1 – g2 – S – g2
(here g1,2 – gradient pulses, S – selective 180° pulse).
The result of the suppression is illustrated below:

[http://u-of-o-nmr-facility.blogspot.ru/2010/02/watergate.html]
WEFT (Water Eliminated Fourier Transform) – a special pulse sequence for suppression of undesired signals. If the solvent and the solute have different spin-lattice relaxation times, suppression of the solvent signals could be achieved by using the inverse-recovery pulse sequence with the delay between 180° and 90° pulses equal to τ = ln(2)T1Solvent. Such a delay corresponds to the zero-point on the magnetisation recovery profile for the solvent signals. The effective suppression of solvent signals requires that T1Solvent >> T1Solute.
4. X{H}
This is a technique for measuring spectra of X nuclei (X = 19F, 31P-15N) decoupled from protons, giving information on X nuclei chemical shifts.
Suppression of the spin-spin couplings between protons and X nuclei allows one not only to strongly simplify the spectrum, but to significantly increase the signal-to-noise ratio too (due to the collapse of multiplets and nuclear Overhauser effect). This is especially useful for the registration of spectra of low-nuclei with low sensitivity, such as 13C. All routine X-nuclei spectra are recorded in this regime.
Further reading:
1. H.-O. Kalinowski, S. Berger, S. Braun, “Carbon-13 NMR Spectroscopy”, Wiley, 1988
2. J.Mason (ed.), Multinuclear NMR, 2nd ed., Plenum Press, 1989
3. T.D.W. Claridge, “High-resolution NMR techniques in Organic Chemistry”, 2nd ed., Elsevier, 2009
4. J. K. M. Sanders, B. K. Hunter, “Modern NMR Spectroscopy, A Guide for Chemists”, 2nd ed., Oxford University Press, 1993
5. X{1H} INVGATE
X-nuclei NMR spectra with proton decoupling (X = 19F, 31P-15N). This technique gives information about the chemical shifts and integral intensities of X-nuclei signals.

X-nuclei NMR spectra with proton decoupling and without the Nuclear Overhauser Effect. In this methods the relative integrated intensities of signals are proportional to the number of corresponding nuclei.
6. X{H}GATEDEC
X-nuclei NMR spectra with proton decoupling (X = 19F, 31P-15N). This technique gives information about the chemical shifts and spin-spin coupling constants JXH for X-nuclei.
This technique allows one to register NMR spectra of X-nuclei without proton decoupling and with the signal intensities affected by NOE.
- 1. O.A. Gansow, W. Schittenhelm, J. Am. Chem. Soc., 1971, 93, 4294-4295.
2. F.W. Wehrli, T. Wirthlin, Interpretation of Carbon-13 NMR Spectra, Heyden, 1978, Ch. 3.
3. M.L. Martin, J.-J. Delpuech, G.J. Martin, Practical NMR Spectroscopy, Heyden, 1980, Ch. 6.2.
4. H.-O. Kalinowski, S. Berger, S. Braun, Carbon-13 NMR Spectroscopy, Wiley, 1988, Ch. 2.3.
7. 13С DEPT, APT
Allows one to distinguish signals of quaternary carbon atoms, CH, CH2 and CH3 groups.

The DEPT experiment (Distortionless Enhancement by Polarization Transfer) allows one to distinguish signals of quaternary, methine, methylene and methyl carbon atoms in 13C NMR spectrum.
Depending on their multiplicity signals can have either positive or negative intensity. The most common variation of DEPT is DEPT135, in which ,ethylene carbon atoms show negative intensity, methane and methyl carbon atoms show positive intensity, while quaternary carbons do not contribute to the spectrum. In DEPT90 spectrum only the methane carbon signals are visible. In DEPT45 quaternary carbons do not show up and all other carbon atoms give rise to the signals with positive intensity.
Quite often, the DEPT experiment is used in combination with 13C{1H} NMR experiment. By analyzing 13C{1H}, DEPT135 and DEPT90 spectra one can derive conclusions about the multiplicity of all carbon atoms in the molecule.
As a result of polarization transfer from proton to carbon atoms in DEPT experiment the sensitivity of this method appears to be approximately four times higher than that of a standard 13C{1H} experiment or an APT (Attached Proton Test) experiment.
The DEPT experiment is less demanding than INEPT to the value of the C-H coupling constant selected for the calculation of one of the delay intervals in the pulse sequence. This feature is useful for the analysis of the molecular structures containing carbon atoms of various nature (with widely different C-H couplings).

The APT method is analogous to DEPT, but it allows one to observe signals from quaternary carbon atoms too (see Figure, a).
8. 13С INADEQUATE
The method gives information about the values of spin-spin coupling contants JCC. Due to the low sensitivity the method requires high concentration of the compound.
The method allows one to obtain information about the structure of the carbon skeleton of the molecule based on the values of spin-spin coupling constants between neighboring carbon atoms. Very low sensitivity of the of the method demands the usage of quite high concentrations of the studied compounds and significantly prolonged acquisition times.
References:
1. A. Bax, R. Freeman, S.P. Kempsell, J. Am. Chem. Soc., 1980, 102, 4849-4851.
2. J. Buddrus, H. Bauer, Angew. Chem. Int. Ed. Engl. 1987, 26, 625-643.
3. C. Dalvit, G. Bovermann, J. Magn. Reson. Ser. A, 1994, 109, 113-116.
4. D. L. Mattiello, R. Freeman, J. Magn. Reson., 1998, 135, 514-521.
5. A. Meissner, O.W. Sorensen, Concepts Magn. Reson., 2002, 14, 141-154.
9. DOSY
The method allows one to separate signals of individual compounds in the mixture if their diffusion coefficients are sufficiently different.
"Molecular diffusion", often simply called diffusion, is the thermal motion of all (liquid or gas) particles at temperatures above absolute zero. The rate of this movement is a function of temperature, size and shape of the particles and viscosity of the fluid. Applying of pulsed field gradients in NMR spectroscopy allows one to measure diffusion rates of nuclear spins [C.S. Johnson, Jr., Prog NMR Spectrosc., 1999, 34, 203-256]. Diffusion of ions, molecules, intermolecular complexes, organometallic complexes and micelles can be studied by NMR.
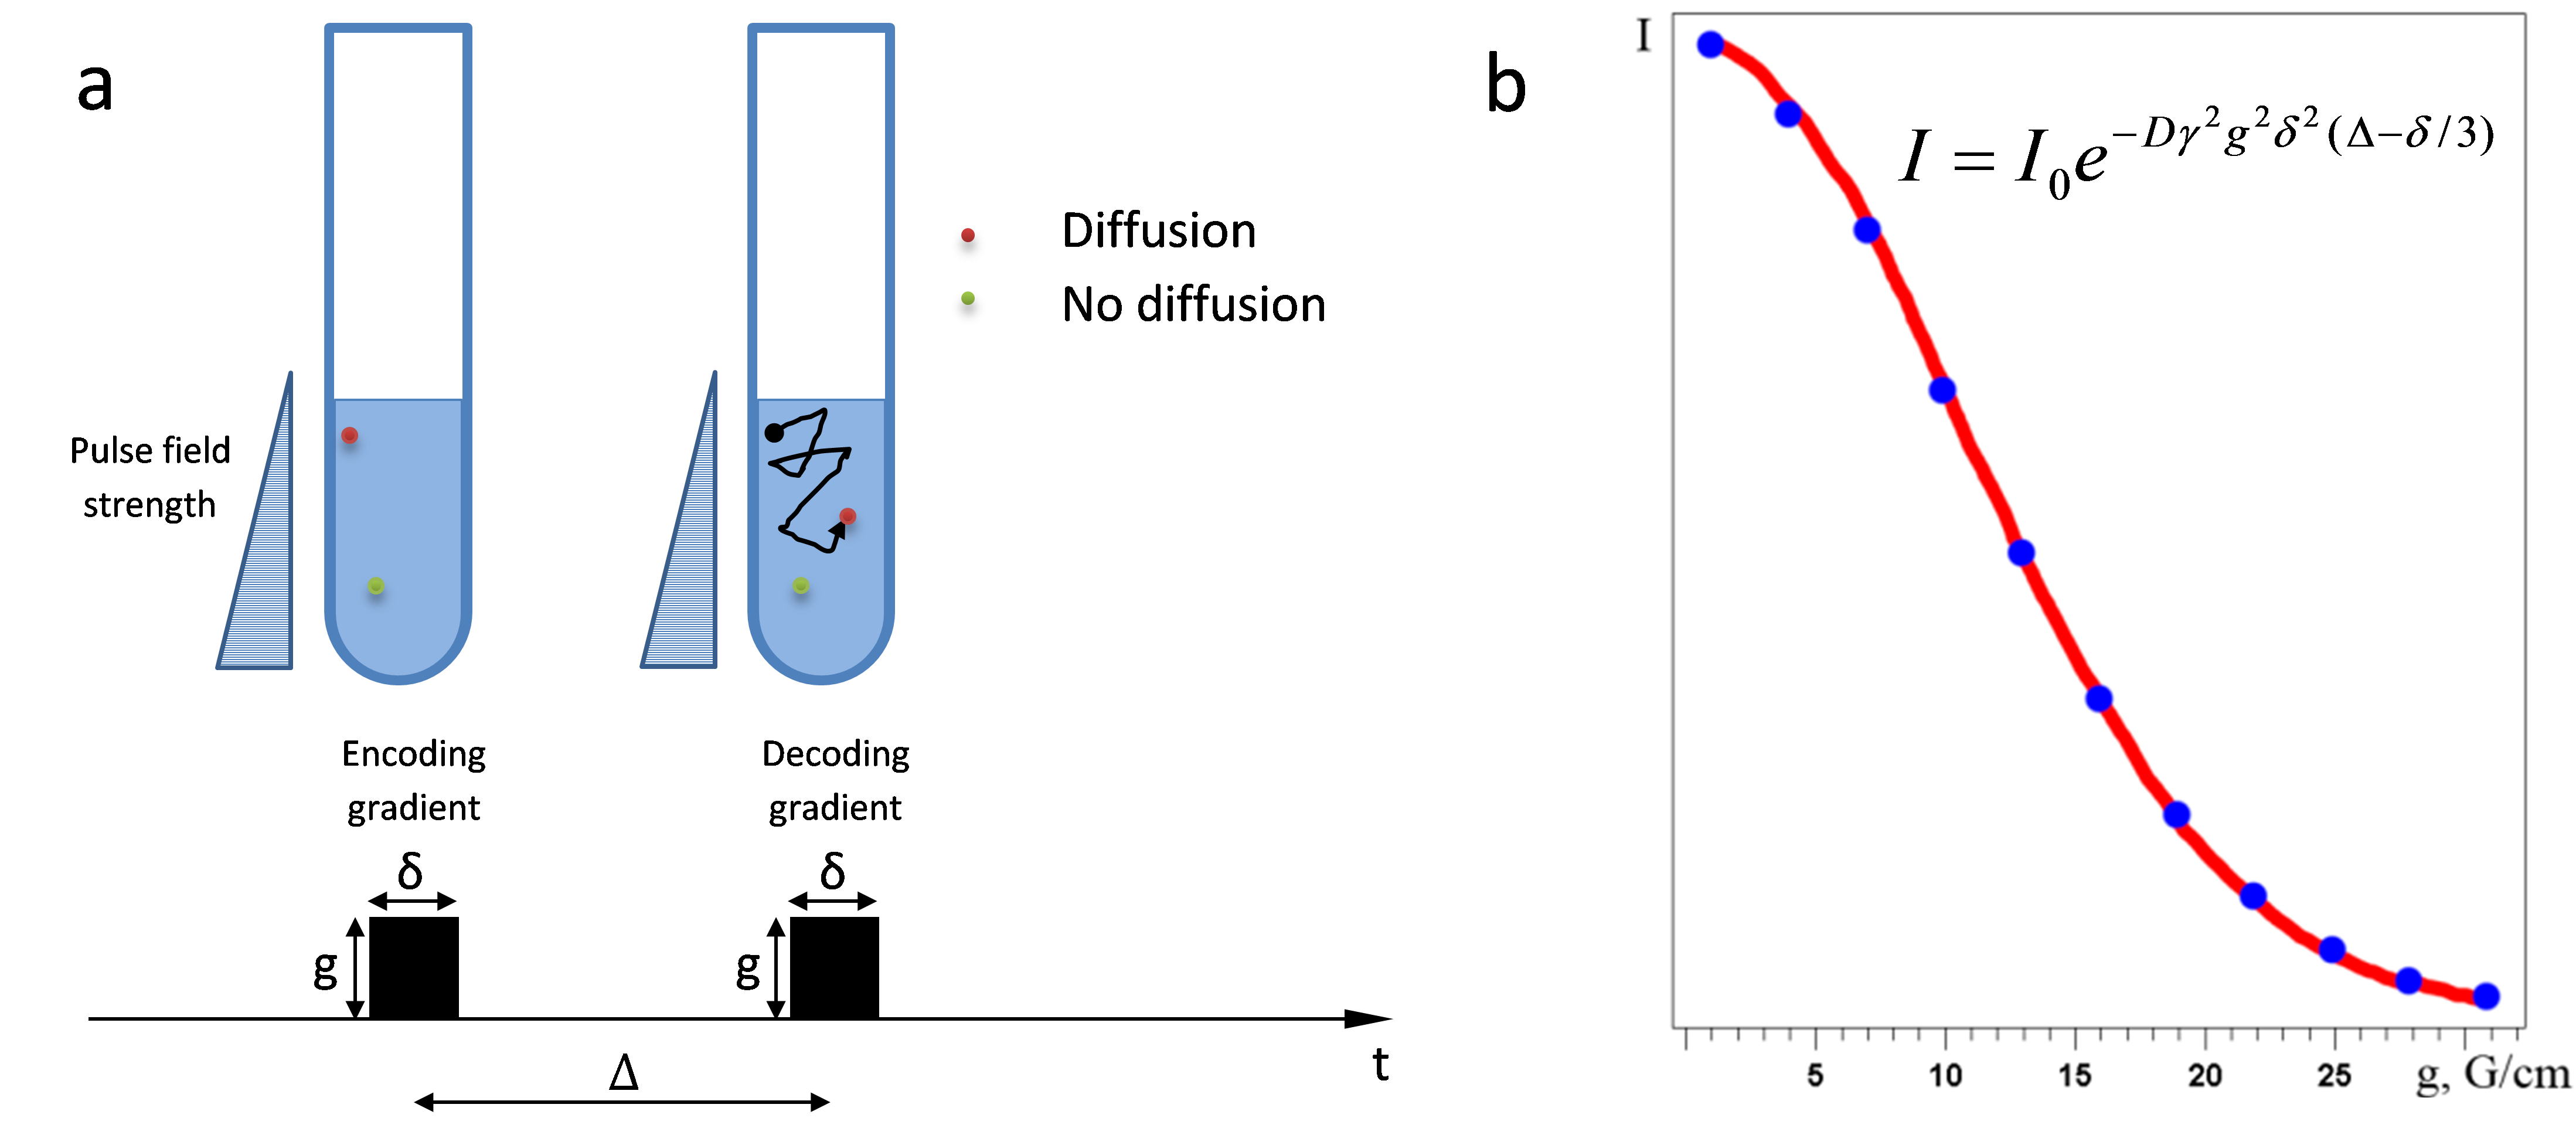
Fig. 1. (a) Applying of pulsed field gradients. (b) Dependence of the intensity of NMR signal on gradient strength, g.
A pulsed field gradient labels (encodes) molecules in the sample according to the spatial layer they occupy, and after diffusion time (Δ) new positions of molecules can be decoded by a second gradient pulse (Fig. 1a). Only those molecules which did not leave their spatial layer contribute to the resulting NMR signal. Attenuation of the intensity of the signal depends on the diffusion coefficient (D), diffusion time (Δ) and gradient parameters (strength g and duration δ). The value of diffusion coefficient can be found by fitting the signal attenuation curve (Fig. 1b).
Usually diffusion experiments are based on two types of pulse sequences:
- Spin echo (PGSE) [Stejskal EO, Tanner JE. J Chem Phys. 1965;42:288-292]
- Stimulated echo (PGSTE) [Tanner JE. J Chem Phys. 1970;52:2523-2526]
For samples with similar spin-lattice and spin-spin relaxation rates (T1 » T2), PGSE sequence is used. In case of T1 >> T2 PGSTE sequence is preferable. The PGSTE sequence delivers only half of the signal intensity in comparison with the PGSE sequence.
Diffusion ordered spectroscopy (DOSY, Fig. 2) allows one to separate spectra of individual components in a mixture depending on their diffusion coefficients.

Fig. 2. Example of a DOSY spectrum.
Applications
Diffusion techniques are used for studying and analysis of solvation [1], formation of ion pairs [2], hydrogen bonds [3], inclusions [4], intermolecular complexes [5], organometallic complexes [6], micelles [7, 8], ionic liquids [9], microemulsions [10], determining size of molecules and aggregates [11], etc. A good review of diffusion NMR methods and applications is given in [12].
- Keresztes I, Williard PG. J Am Chem Soc. 2000; 122: 10228-10229.
- Binotti B, Macchioni A, Zuccaccia C, Zuccaccia D. Comments Inorg Chem. 2001; 23: 417-450.
- Pastor A, Martinez-Viviente E. Coord Chem Rev. 2008; 252: 2314-2345.
- Cameron KS, Fielding L. Magn Reson Chem. 2002; 40: S106-S109.
- Brand T, Cabrita EJ, Berger S. Prog In NMR Spect. 2005; 46: 159-196.
- Pregosin PS. Spectrosc Prop Inorg Organomet Compd. 2012; 42: 248-268.
- Furo I. J Mol Liq. 2005; 117: 117-137.
- Asaro F, Savko N. Magn Reson Chem. 2011; 49: 195-198.
- Weingartner H. Curr Opin Colloid Interface Sci. 2013; 18: 183-189.
- Hathout RM, Woodman TJ. J Controll Release. 2012; 161: 62-72.
- Macchioni A, Ciancaleoni G, Zuccaccia C, Zuccaccia D. Chem Soc Rev. 2008; 37: 479-489.
- Johnson CS Jr. Prog NMR Spectrosc. 1999; 34: 203-256.
Temperature measurements. Reduction of convection in the sample
Depending on the viscosity of the solution and the temperature inside the sample convection flows can be produced. These flows have the same effect as diffusion and lead to increased molecular mobility. The reduction of the influence of convection in the sample can be achieved by the following:
- Using samples with decreased volume, such as Shigemi tube (Fig. 3a), sample tube with smaller diameter (Fig. 3b), or capillary (Fig. 3c).
- Using heat exchange medium inside the NMR sample tube, such as coaxial insert (Fig. 3d), or capillary (Fig. 3e).
- Using special pulse sequences for convection compensation, such as Double PGSTE [Jerschow A, Mueller N. J Magn Reson. 1997; 125: 372-375].
- Using gradient cooling system for temperature stabilization (Fig. 3g) instead of standard air flow (Fig. 3f).
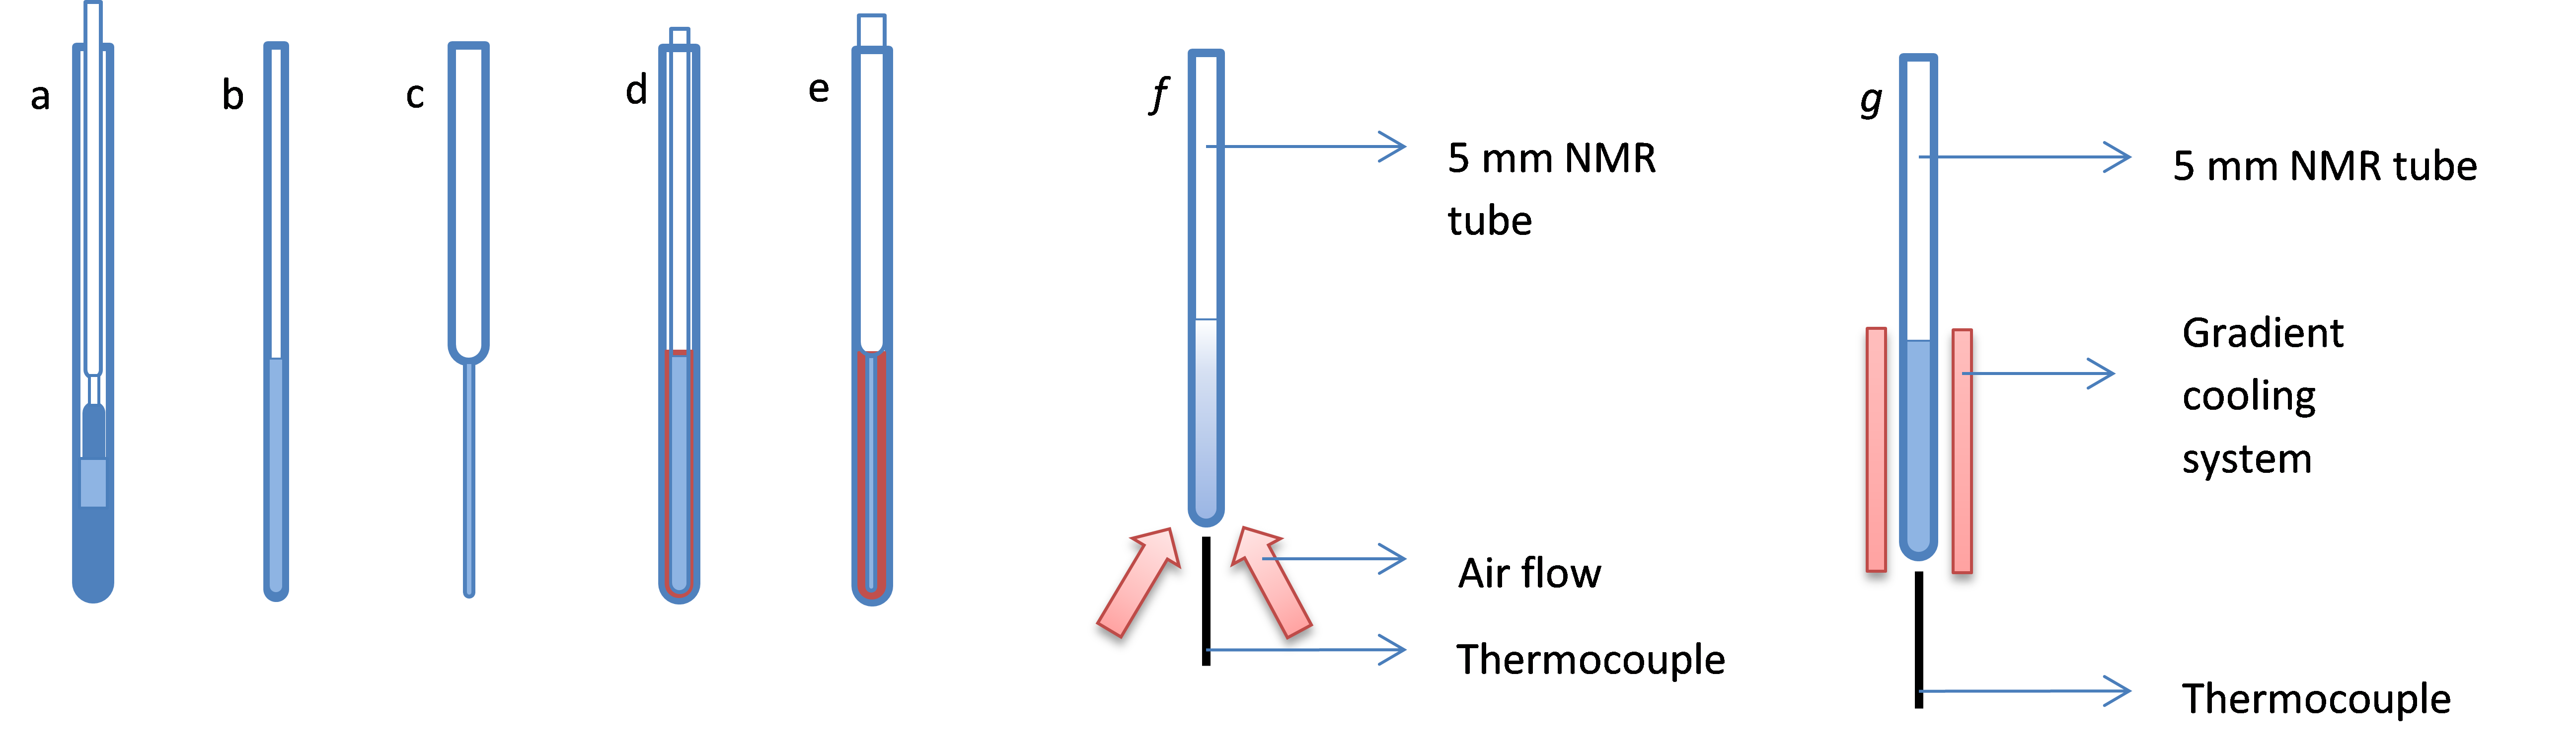
Fig. 3. (a)-(e) Various sample tube shapes used to decrease the effects of convection in the NMR sample. (f) Air flow temperature stabilization system. (g) Temperature stabilization by gradient cooling system.
Currently available at CMR
Apart of standard pulsed gradient field equipment available for liquid-state NMR instruments, Center for Magnetic Resonance has dedicated Bruker 60 Ampere gradient amplifiers with Bruker Diff50 probe and 5 mm coils for 1H, 2H, 7Li, 13C{1H}, 19F, 23Na, 31P, 133Cs nuclei. This extends the range of accessible diffusion coefficients to 10-9 … 10-13 m2/s. Available temperature range is from -40°С to +80°С and from +25°С to +45°С for gradient cooling.
10. Low temperature measurements of the NMR spectra of liquids
One of the characteristic features of NMR spectroscopy is its time resolution, which is much lower than that in optical spectroscopy. Though studies of magnetization relaxation rates in principle provide information about the processes with rates as high as NMR frequency itself (modern spectrometers operate usually at hundreds of MHz), for many applications the time resolution is limited by chemical exchange processes with rates as low as kHz or even several Hz. In the fast exchange regime signals of exchanging species are averaged out into a coalesced peak. By lowering down the temperature or otherwise slowing down the exchange one can observe separate signals of individual species or conformers. In the intermediate regime the signals are broadened and the line shape is distorted. As an example in Figure 1 we show the evolution of the line shape for a hypothetical symmetric two-site exchange (the illustration is courtesy of Prof. Dr. H.-H. Limbach; a number of relevant equations – hopefully, self-explanatory – is given in the right-hand side of the Figure). The analysis of the temperature-dependent line shapes can be used to find out energetic and thermodynamic parameters (energy barriers Ea, DH, DS) of the exchange process. For a comprehensive description of the dynamic NMR we refer the reader to the textbooks of H. Guenther [Guenther H. NMR Spectroscopy. Wiley; 2013] or J. Sandstorm [Sandstorm J. Dynamic NMR Spectroscopy. Academic Press; 1983].

Fig. 1. The evolution of the line shape for a hypothetical symmetric two-site exchange (courtesy of Prof. Dr. H.-H. Limbach) with a set of relevant equations.
In the investigations of hydrogen-bonded complexes slowing down proton and molecular exchange processes is crucial if one wants to observe intrinsic NMR parameters of complexes with different stoichiometry, conformation and H/D isotope composition. Typical NMR solvents offer the variety of accessible temperature ranges (see Table 1), but often this is not enough and an extremely low-freezing solvent is desirable. In this case a mixture of deuterated freonic gases CDF3/CDF2Cl, which freezes below 100 K, can be employed (see 1H, 13C and 19F NMR spectra of the Freon mixture in Figure 2). This solvent shows decent ability to dissolve organic compounds, similar to that of CDCl3.The synthetic procedure and experimental setup for using freonic solvents was developed in St.Petersburg State University by Dr. Nikolai Golubev and Prof. Dr. Gleb Denisov (see, f.e. [Golubev NS, Denisov GS. Doklady Russ Acad Sci. 1975;220:1352-1355 (in Russian)][Golubev NS, Denisov GS, Koltsov AI. Doklady Russ Acad Sci. 1976;230:880-883 (in Russian)]) and later on extensively used in collaboration with Prof. Dr. Hans-Heinrich Limbach at Freie Universitaet Berlin [Shenderovich IG, Tolstoy PM, Golubev NS, Smirnov SN, Denisov GS, Limbach H-H. J Am Chem Soc. 2003;125:11710-11720][Tolstoy PM, Schah-Mohammedi P, Smirnov SN, Golubev NS, Denisov GS, Limbach H-H. J Am Chem Soc. 2004; 126: 5621-5634]. This technique is re-establishing at SPbU in the CMR.
Table 1. Freezing temperatures of typical NMR solvents (data for non-deuterated isotopologs)
|
Solvent |
Freezing temperature, K (°C) |
|
DMSO-d6 |
292 (19) |
|
Benzene-d6 |
278.7 (5.5) |
|
Pyridine-d6 |
231.6 (–41.6) |
|
CDCl3 |
209.7 (– 63.5) |
|
Acetone-d6 |
179 (–94) |
|
CD2Cl2 |
176.5 (–96.7) |
|
CD3OD |
175.6 (–97.6) |
|
THF-d8 |
164.8 (–108.4) |
|
CDF3/CDF2Cl |
< 100 K (< –173) |

Fig. 2. The 1H, 13C and 19F NMR spectra of the liquefied mixture CDF3/CDF2Cl (or residual proton-containing species in 1H NMR spectrum, where also the signals of small amounts of CHCl3 and CHFCl2 are visible).
An interesting feature of CDF3/CDF2Cl mixture is that its dielectric constant changes significantly with temperature (ca. 20 at 170 K and ca. 45 at 95 K for 1:1 mixture; see Figure 3) [Shenderovich IG, Burtsev AP, Denisov GS, Golubev NS, Limbach H-H. Magn Reson Chem. 2001; 39: S91-S99].

Fig. 3. Change of dielectric constant of CHF3/CHF2Cl 1:1 mixture with temperature. For comparison curves for neat CHF3 and CHF2Cl are shown. Adapted from Ref. [11].
Using liquefied freonic gases as solvent, in recent years some of us were able to study a number of intra- and intermolecular hydrogen bonded complexes, especially focusing on the hydrogen bond geometry, on the position of the proton in the hydrogen bridge and on the processes of proton transfer. Examples of several studied systems and some representative NMR spectra are shown in Figures 4 and 5. Results obtained for these systems were reported in ref. [Guo J, Tolstoy PM, Koeppe B, Golubev NS, Denisov GS, Smirnov SN, Limbach H-H. J Phys Chem A 2012; 116: 11180-11188] (Figure 4a,b), [Guo J, Koeppe B, Tolstoy PM. Phys Chem Chem Phys. 2011; 13: 2335-2341] (Figure 4c), [Tolstoy PM, Guo J, Koeppe B, Golubev NS, Denisov GS, Smirnov SN, Limbach H-H. J Phys Chem A 2010; 114: 10775-10782] (Figure 4d), [Guo J, Tolstoy PM, Koeppe B, Denisov GS, Limbach H-H. J Phys Chem A 2011; 115: 9828-9836] (Figure 5a) and [Ajami D, Tolstoy PM, Dube H, Odermatt S, Koeppe B, Guo J, Limbach H-H, Rebek J Jr. Angew Chem Int Ed. 2011; 50: 528-531] (Figure 5b), among other publications.

Fig. 4. Examples of hydrogen bonded intermolecular complexes and their NMR spectra studied in recent years by some of us using liquefied freonic mixture CDF3/CDF2Cl as solvent
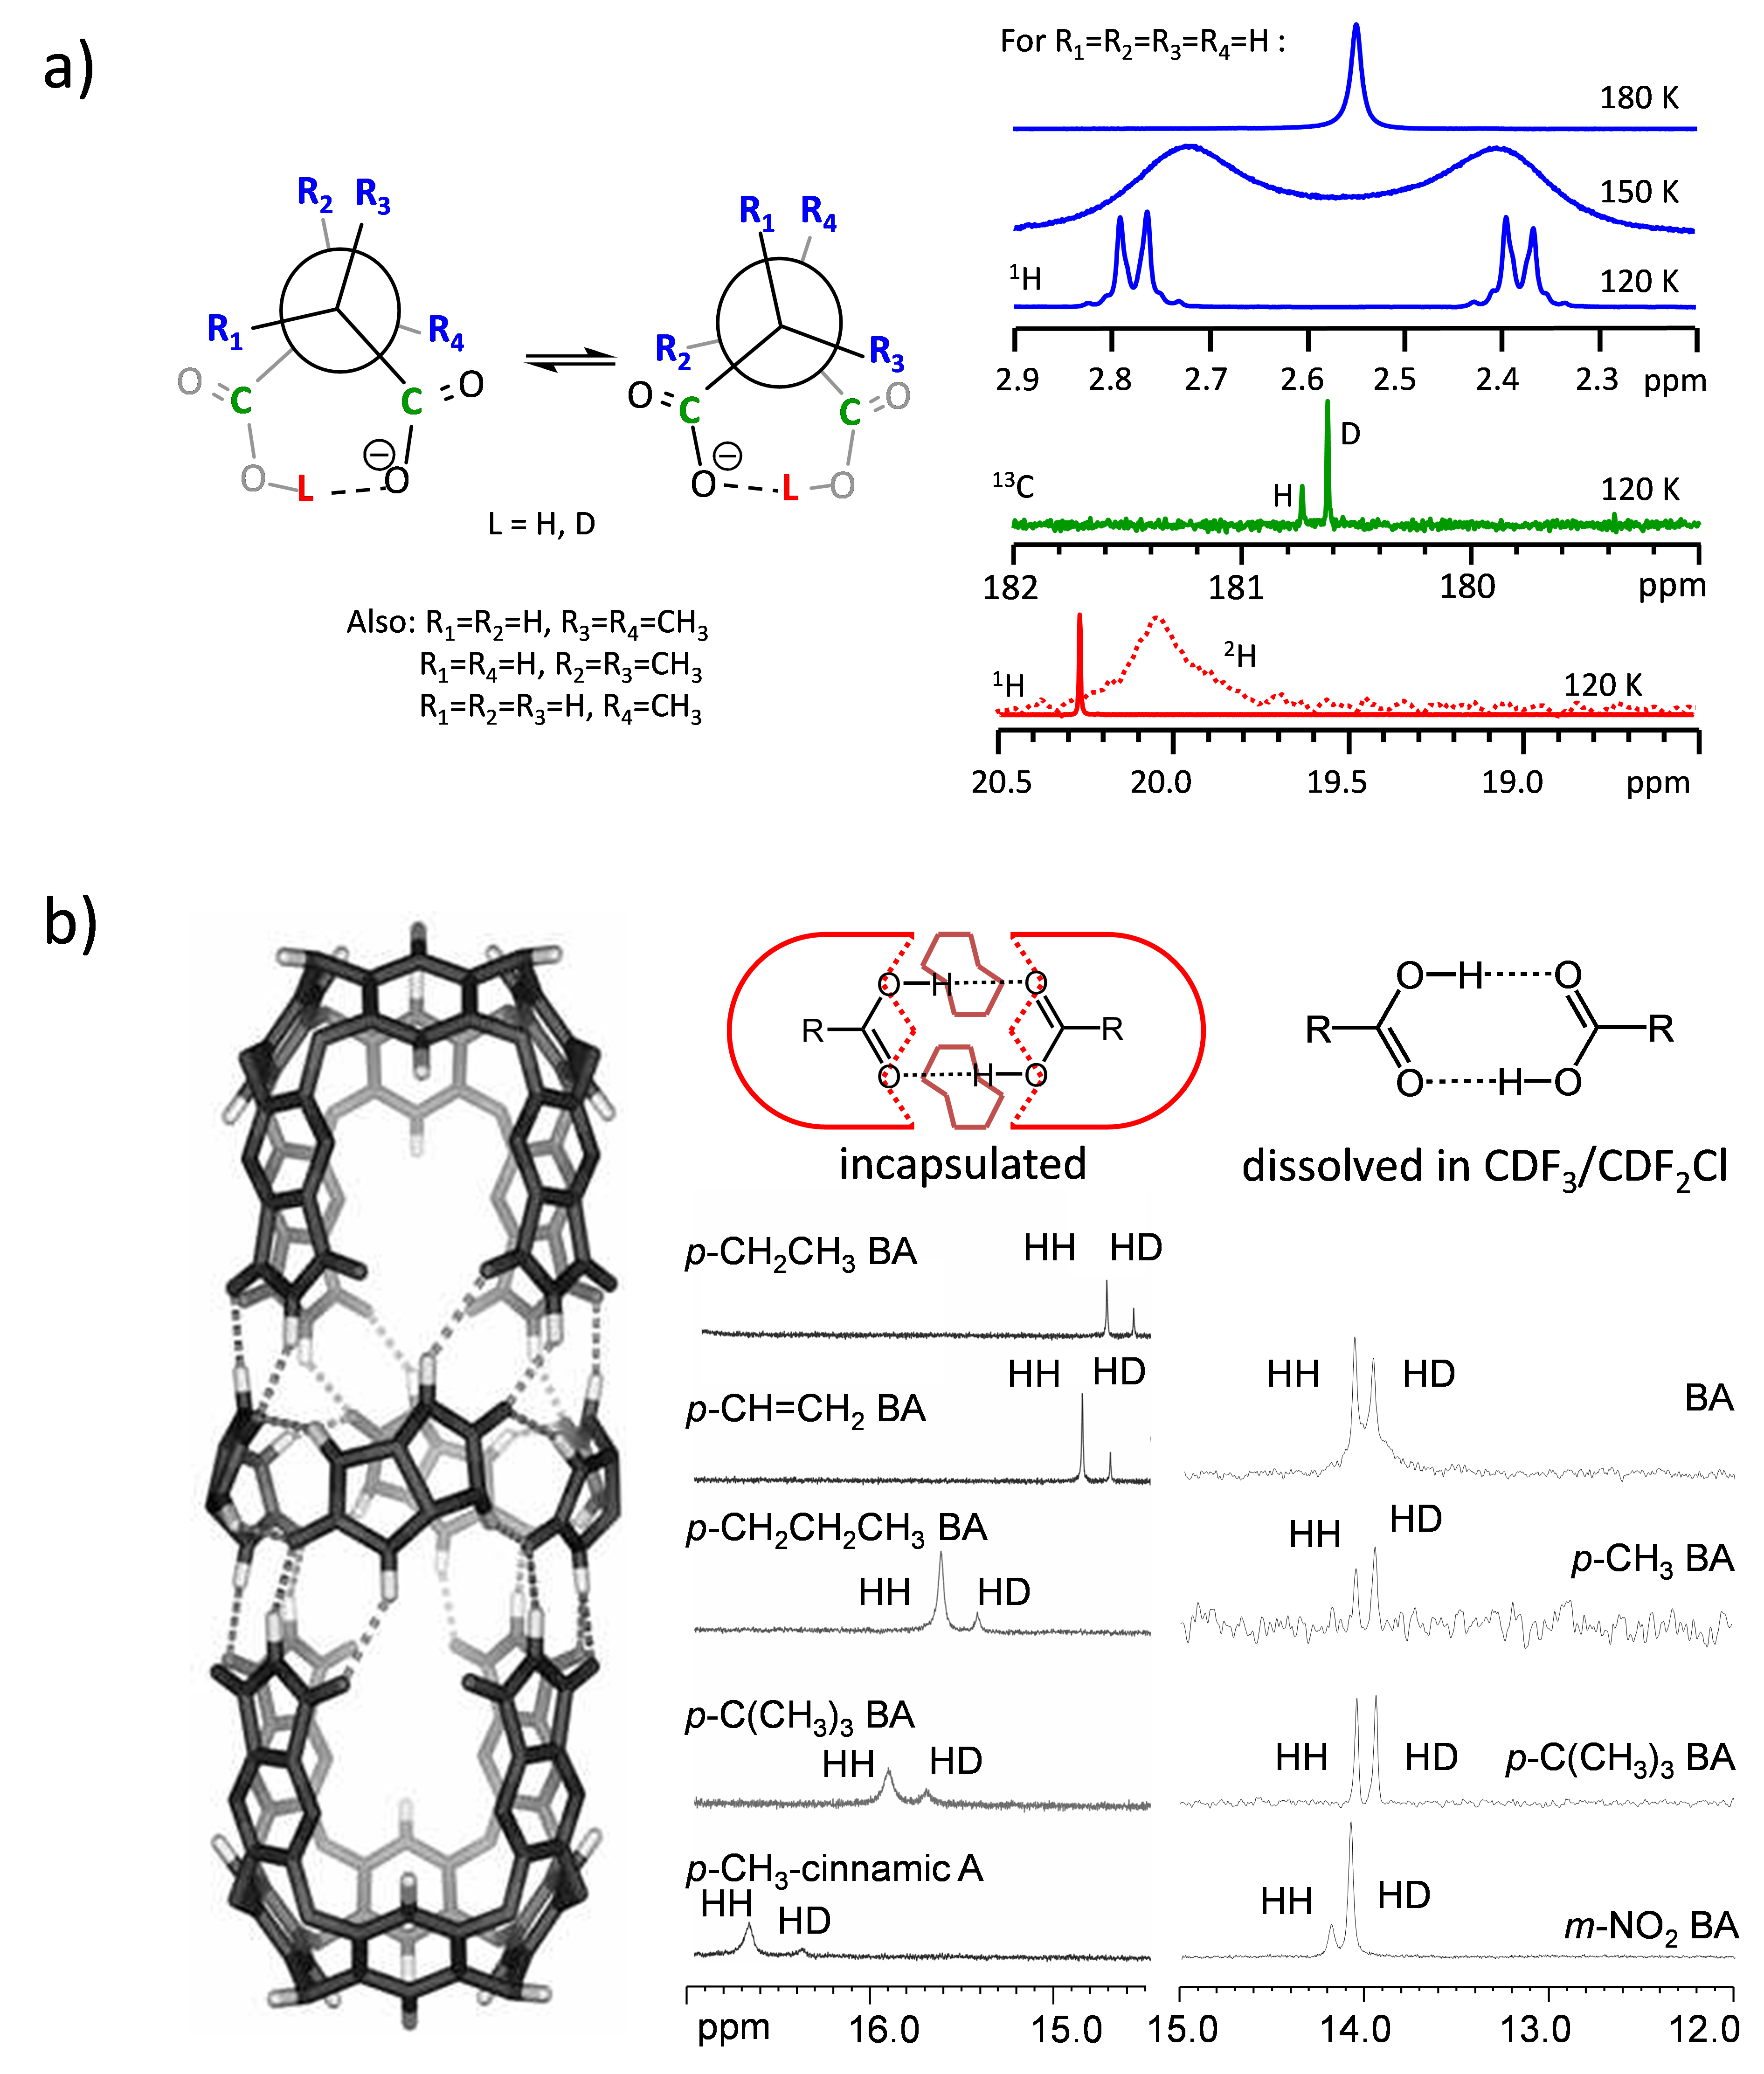
Fig. 5. Examples of hydrogen bonded intermolecular complexes and their NMR spectra studied in recent years by some of us using liquefied freonic mixture CDF3/CDF2Cl as solvent.

")